

Adding charts to WPF applications was, at the beginning of the decade (2010 – 2020), done from the ground up, using the built-in WPF toolkit that was released in June 2009. And as time is the currency of development, one would not want to spend it trying to conceive a good-looking and comprehensible chart because that would take so long! Later on, many libraries would come out to the world to introduce better, interactive and easy to use charts. In this article, we suggest using LiveCharts, a library that offers high performance, nice UI and diverse functionalities, and see how we can implement it in the code which, by the way, is very easy to do !
What is Live Charts
LiveCharts is an open source full solution library for .Net technologies and is dedicated to data visualization, creating simple interactive charts, maps and more ! I find the library so easy to use, wether developping a WPF app or any other technology on .Net.
You can find more information on their website : lvcharts.net
or on their github repository : github.com/Live-Charts/Live-Charts .
How to add Live Charts to you WPF app:
We can install the package on Visual Studio using NuGet, which offers a Package Manager with a great friendly and easy to use interface, or we can install it through the console:
a – Using NuGet Package Manager:
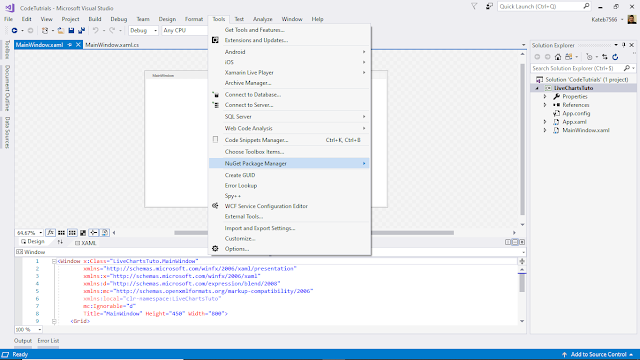
First of all steps we want to see how to use the package manager :1 – We open Visual Studio on the project to which we want to add Live Charts, go to tools -> NuGet Package Manager on the menu bar:
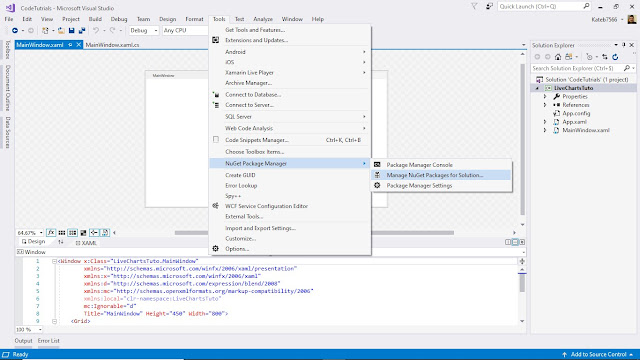
2 – We, then, select Manage NuGet packages for solution… as the figure below shows :
3 – Once we make the click, we get to see the following interface :
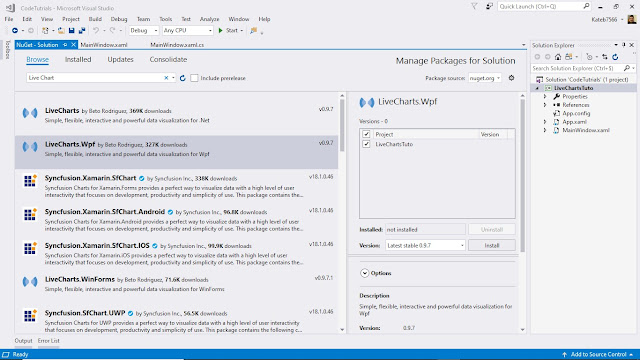
On this interface we click on browse high up above the search bar, after that we make the search on Live Chart, we choose WPF version. Click install, wait for it, you are ready to go !
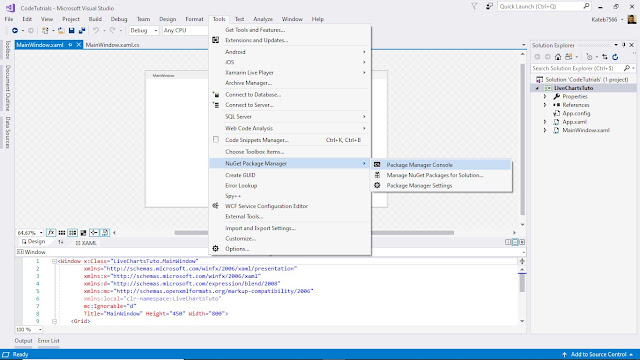
b – Using NuGet Console :
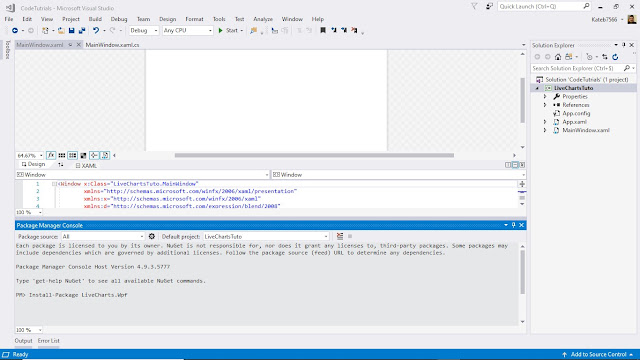
As for the console I guess less steps look better for many people, all we need to do is to open up the console :
1 – Once the console is open, we are going to write this line and click Enter :
Install-Package LiveCharts.Wpf
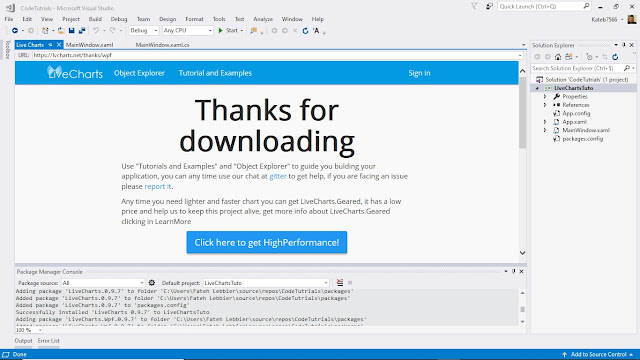
2 – When the download is finished and the package gets installed we are expecting to see the following page :
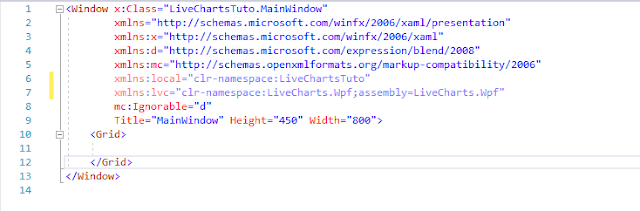
Well, the last thing we should do to have our application capable of using Live Charts, we need to add some lines of code :A namespace to your XAML :xmlns:lvc=”clr-namespace:LiveCharts.Wpf;assembly=LiveCharts.Wpf”
And these lines to the code behind :
using LiveCharts;using LiveCharts.Wpf;Now, we can start using the package to create some awesome charts !
How can you use it :
Live charts offers a pack of all sorts of awesome charts that one would find very useful ! We are going to choose one of them, and let’s go for classic one ! a Basic Column Chart :1 – First we need to create a WPF project on Visual Studio ( I am using VS2017) :
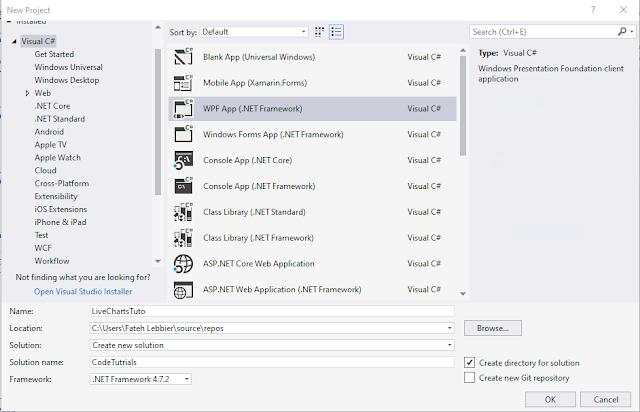
We name the project “LiveChartsTuto”, then click ok !
2 – Once the project is created and the library installed, we can create our chart now ! (the installation procedure was described in the previous section).
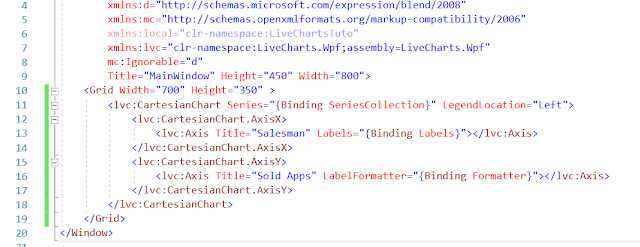
3 – to do that we need to add this code to XAML :
<lvc:CartesianChart Series=”{Binding SeriesCollection}” LegendLocation=”Left”>
<lvc:CartesianChart.AxisX>
<lvc:Axis Title=”Salesman” Labels=”{Binding Labels}”></lvc:Axis>
</lvc:CartesianChart.AxisX>
<lvc:CartesianChart.AxisY>
<lvc:Axis Title=”Sold Apps” LabelFormatter=”{Binding Formatter}”></lvc:Axis>
</lvc:CartesianChart.AxisY>
</lvc:CartesianChart>
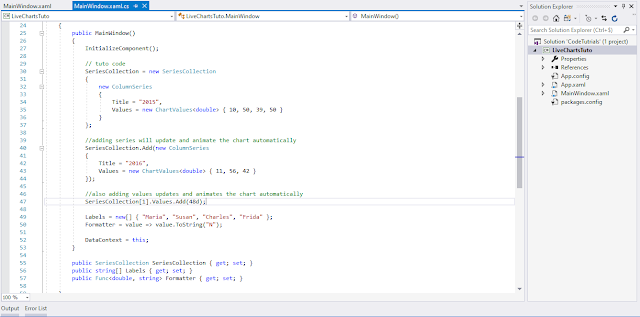
4 – After adding XAML we need to add another piece of code to the code behind, (adding data to the chart).
public partial class mainwindow : window
{
public mainwindow()
{
initializecomponent();
// tuto code
seriescollection = new seriescollection
{
new columnseries
{
title = “2015”,
values = new chartvalues<double> { 10, 50, 39, 50 }
}
};
//adding series will update and animate the chart automatically
seriescollection.add(new columnseries {
title = “2016”,
values = new chartvalues<double> { 11, 56, 42 }
});
//also adding values updates and animates the chart automatically
seriescollection[1].values.add(48d);
labels = new[] { “maria”, “susan”, “charles”, “frida” };
formatter = value => value.tostring(“n”);
datacontext = this;
}
public seriescollection seriescollection { get; set; }
public string[] labels { get; set; }
public func<double, string> formatter { get; set; }
}
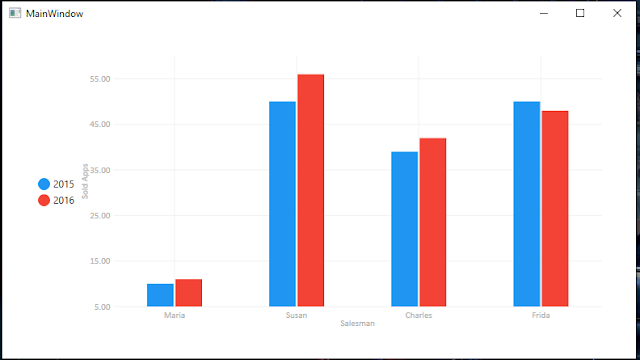
It should look like this :
After that you can build the solution and start clicking f5, and voila !
The market requires more expressive software, which imposes better user experience and high profile developers; and nothing makes this any easier for developers than libraries and frameworks. Live charts are just one of many great libraries that make data visualization too easy and developing WPF applications more exciting!
